Charts

A circle charts are used to visualize information and data. They are usually used to easily show the results of an investigation in a proportional manner. Add charts section to present data effectively. Each chart is animated and has own individual settings.
Live example ↗ (opens in a new tab)
How to add section
Follow the instruction here, but search the section named Info: Charts.
Block Types
There are two block types available in this section:
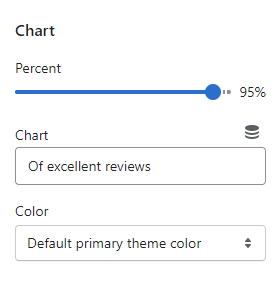
Chart
This is simple chart where you can only change the persent value, chart text and circle color

Horizontal
Vertical
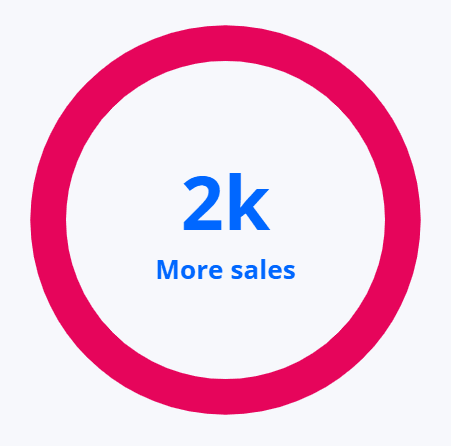
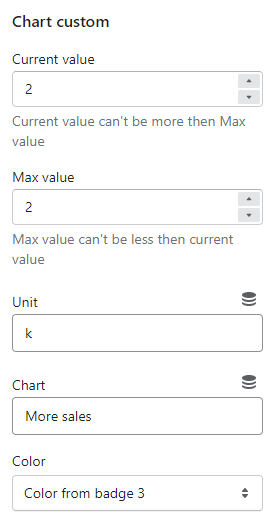
Chart custom
This block has advanced settings. In addition to the settings available in the previous block, you can set custom value instead of the standard percentages.
Horizontal
Vertical